Sanity management dashboard
First look at the dashboard
Section titled “First look at the dashboard”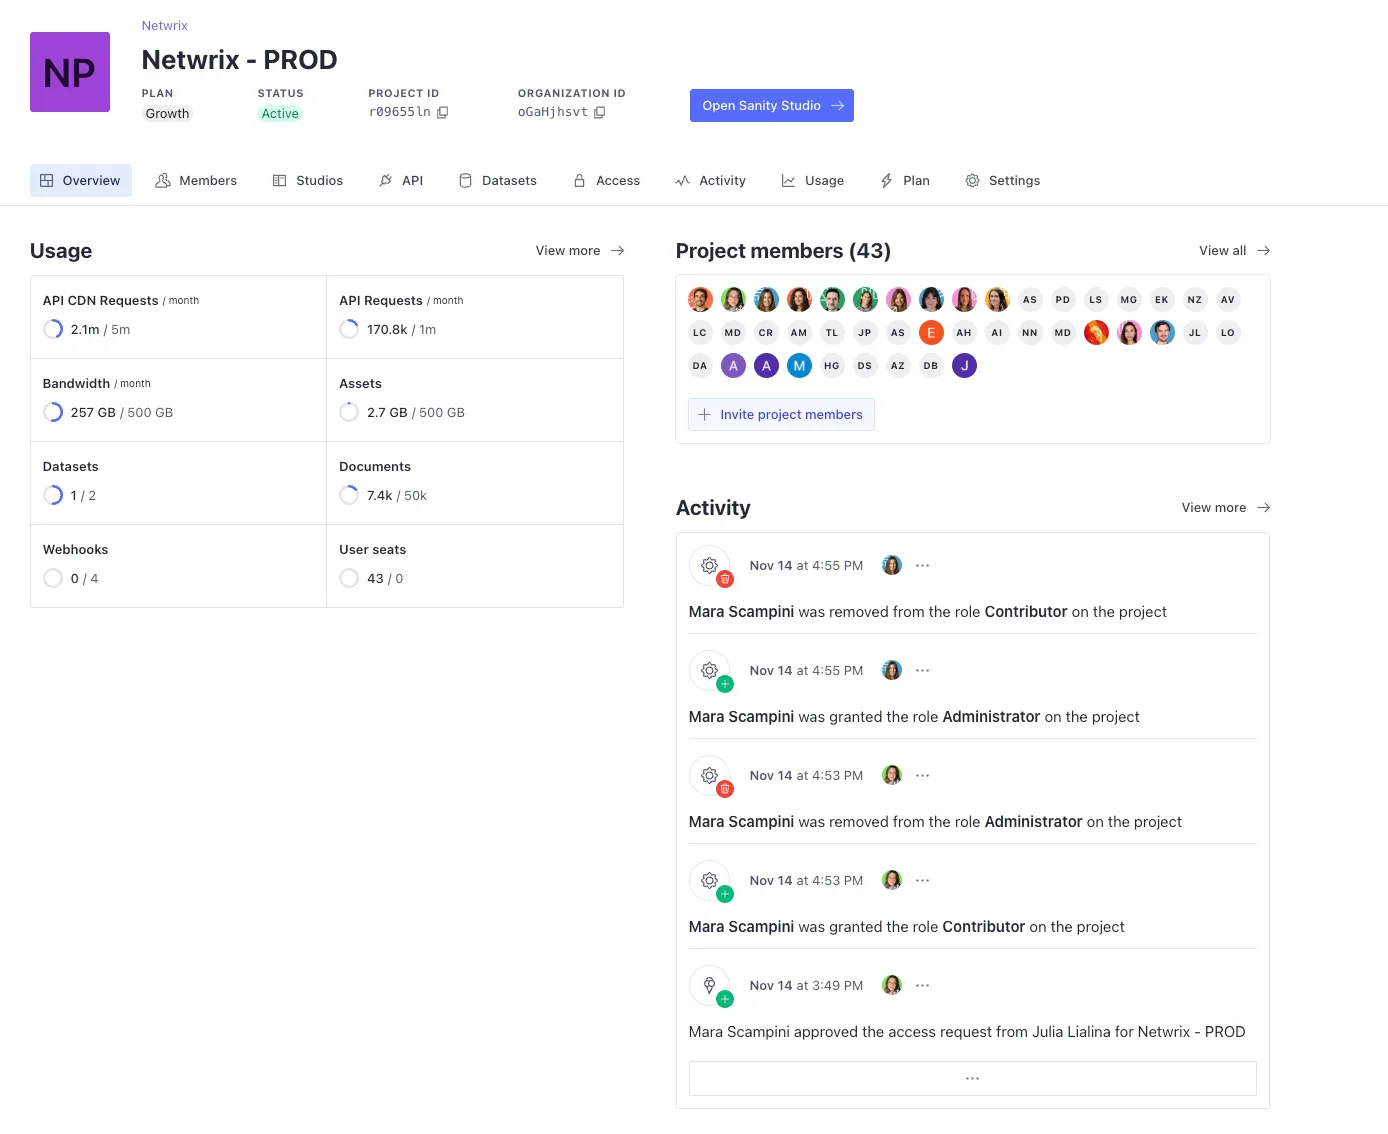
This is how the dashboard looks when we first get in. This shows a summary of our project status, let’s go over each section and its relevance for dev purposes.
Members
Section titled “Members”Here you can add / revoke members and change permissions.
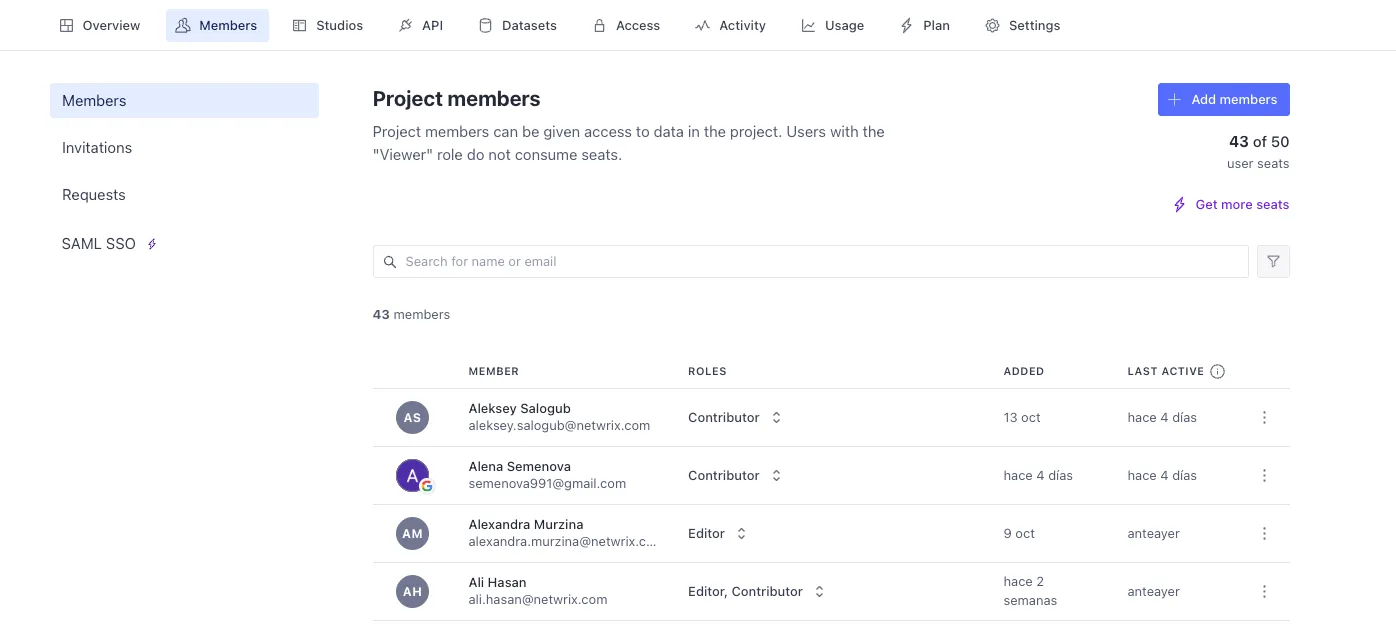
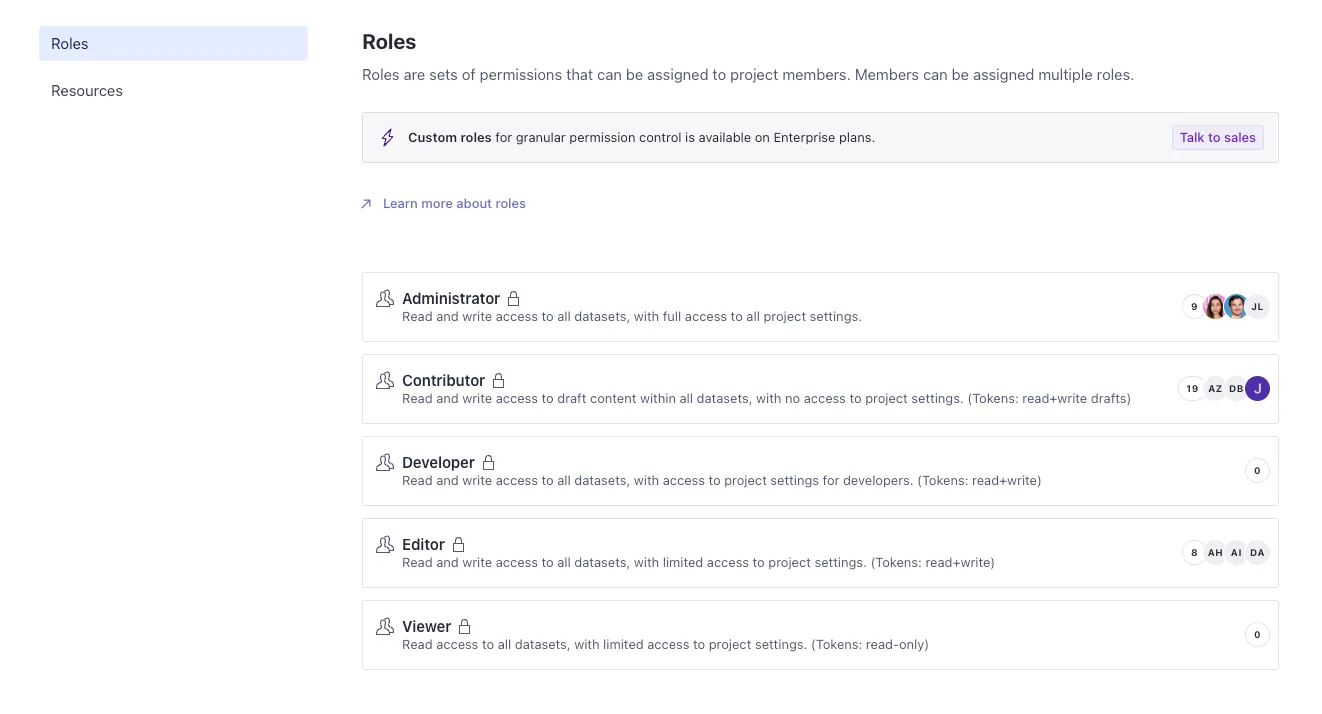
The growth plan has 5 roles available:
- Administrator - All access
- Developer - Read / write permissions + access to dev settings in this dashboard
- Editor - Complete read / write permissions (they can publish, unpublish and delete docs)
- Contributor - Partial read / write permissions (they can only create and edit documents)
- Viewer - Only read permissions
Studios
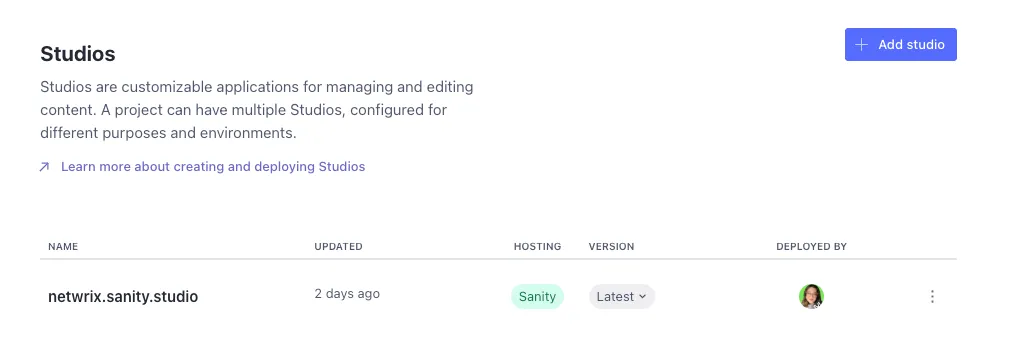
Section titled “Studios”Here’s where your Studio will be first created and where you can add more studios (even self-hosted ones) that will contain your data.
In this section you will be able to access several tools useful for development:
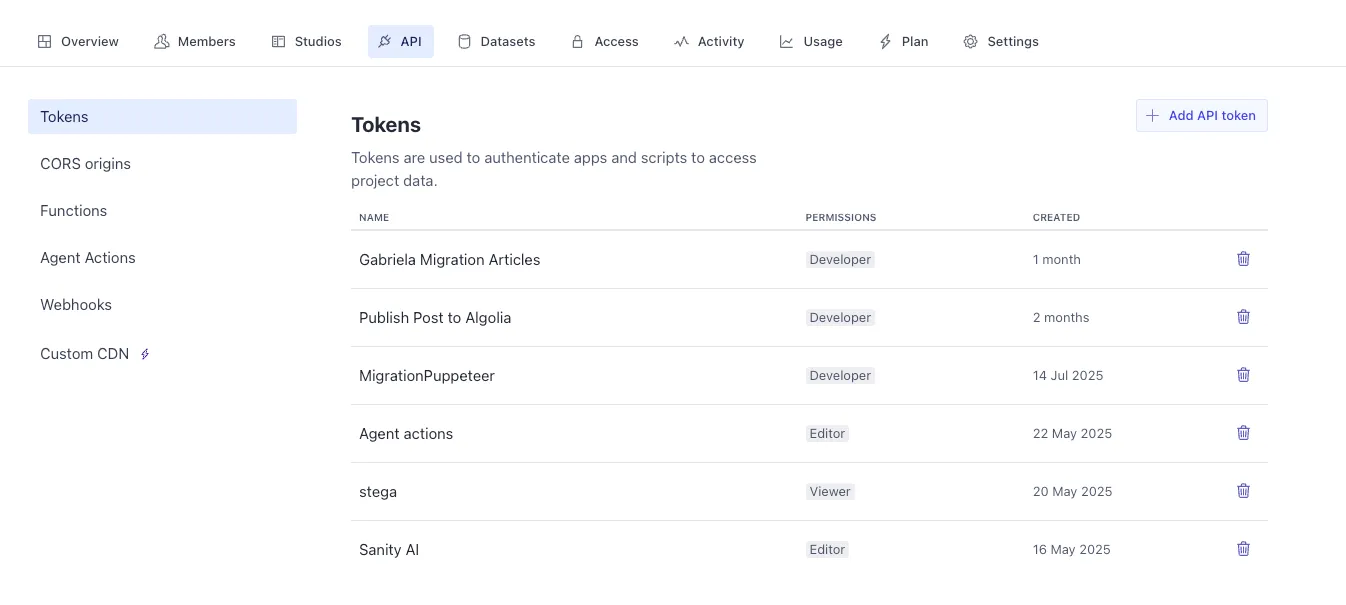
- Tokens - to add API keys that give read / write access to your data
- CORS origins - to establish domains which your data can be accessed from
- Functions - to create custom functions that act whenever your content changes
- Agent actions - functions that make use of Sanity’s integrated AI
- Webhooks - API endpoints triggered by changes in your data
Datasets
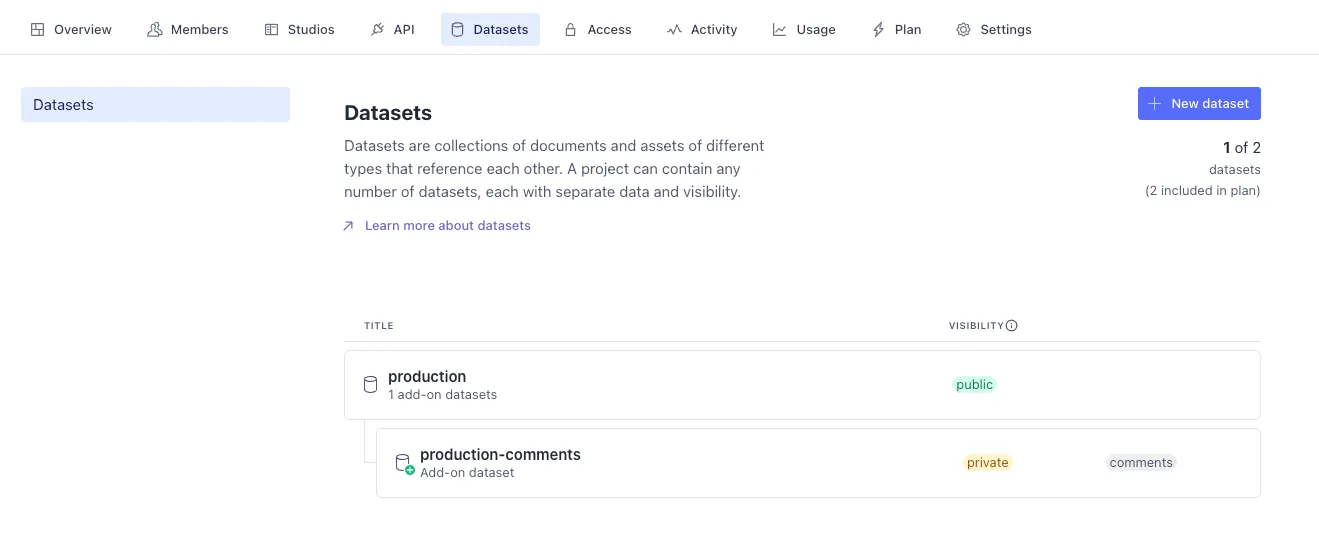
Section titled “Datasets”Here you can add extra datasets, for instance, a stage / dev dataset that will not be available in the production page. We work with only production dataset because it’s easier to manage while making the data migration, but it is possible to create new datasets.
Access
Section titled “Access”This is where you can see all your available roles and see the exact permissions they have (for default roles) or edit them (for custom roles - available only in Enterprise)
Activity
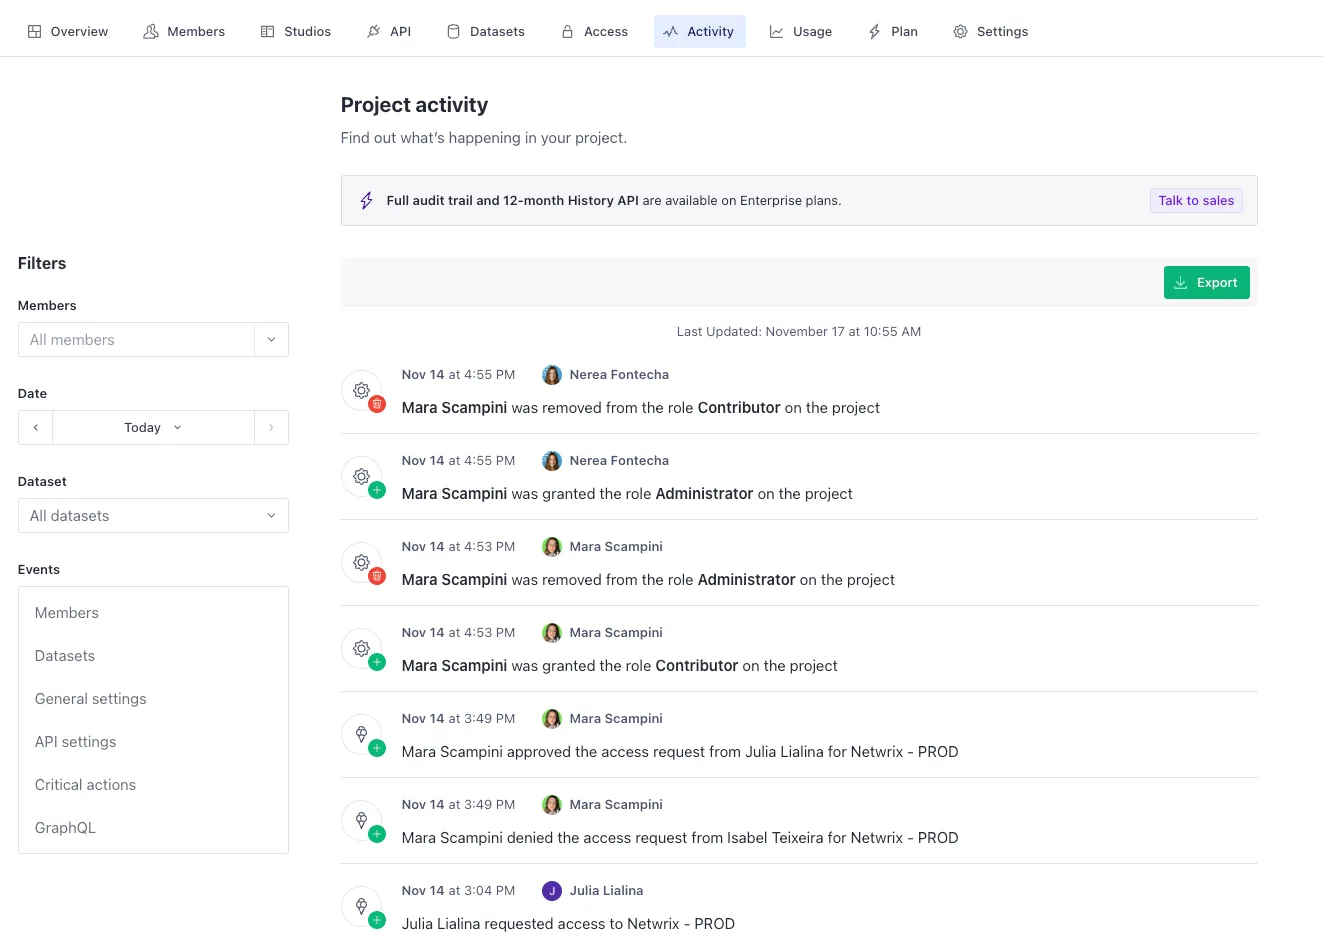
Section titled “Activity”This tab allows you to track who did what in the dashboard: who gave access to who, what roles were changed and by whom, etc.
Here is where all usage quotas are tracked: API requests, bandwidth, amount of assets, datasets, documents…
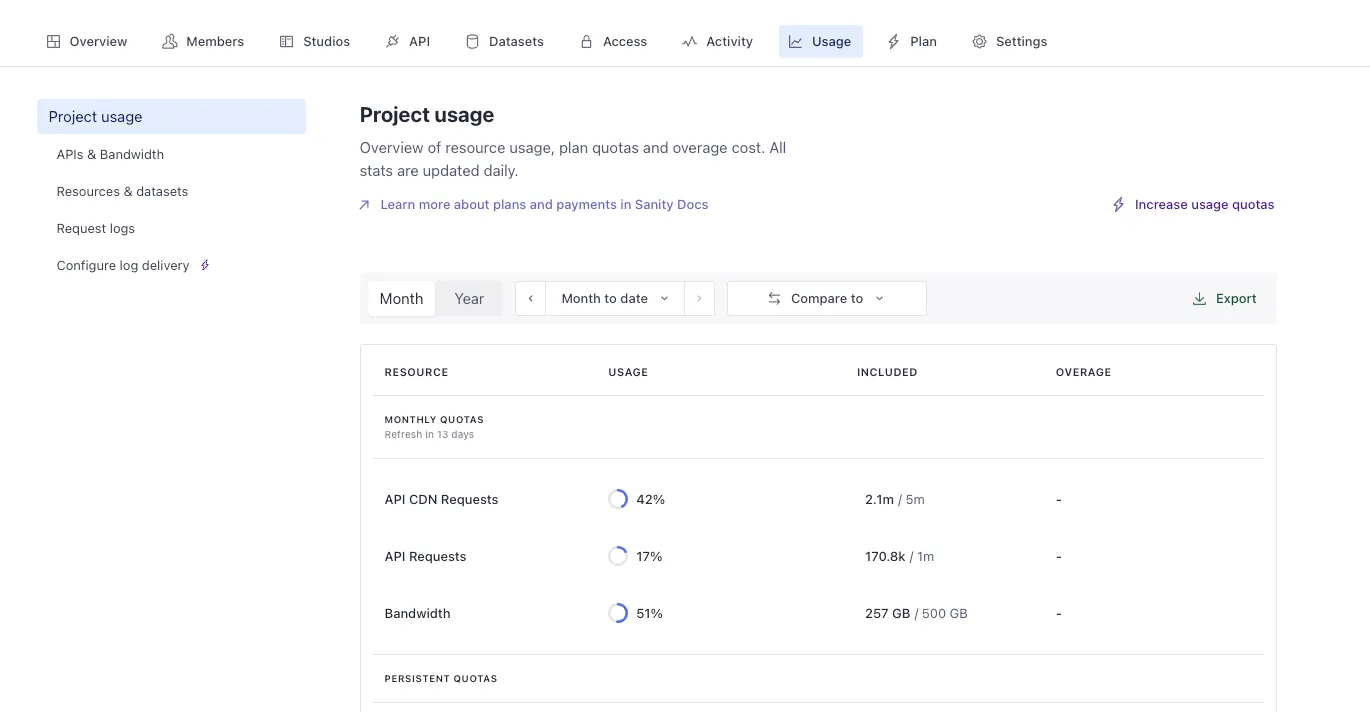
This is also where request logs for the last seven days can be generated.